
The K-Shaped Consumer Is Breaking Your Average Customer Assumptions

The most dangerous customer in your strategic plan may be the one who does not exist. That customer has an average income, an average basket and an average willingness to pay. They show up in your forecasts, your pricing and your budgets. The people actually buying from you look less like them every quarter.
On October 15, the National Retail Federation forecast that United States holiday sales will grow 4.2% to $1.013 trillion across November and December, as The Boston Globe reported in Retailers project a record $1 trillion holiday shopping season. But who's doing the spending? The headline number looks strong. The detail underneath it matters more. NRF chief economist Mark Mathews said that in some retail sectors, the top 10% of spenders account for as much as 70% of total sales. On the pattern itself, he was direct. "We definitely see a K."
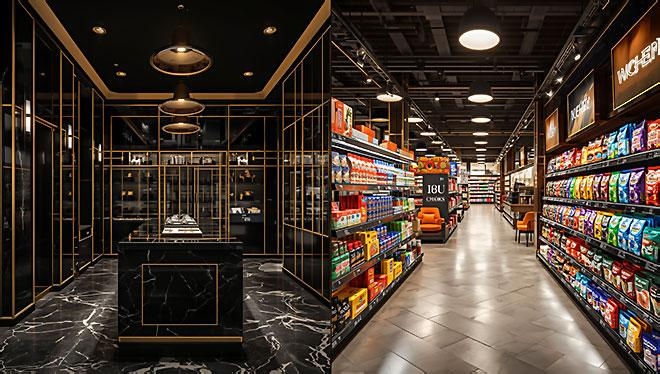
That K describes many customer bases right now. One arm keeps rising while the other feels the squeeze. Both arms feed the same revenue report, so the total can look healthy while the base underneath it splits. A plan built on the middle of that shape serves nobody in particular.
How the K-Shaped Consumer Breaks the Average
The K-shaped consumer is not one buyer with mixed feelings. It is two groups of buyers on different paths. Higher-income households keep spending. Lower-income households feel the pressure of higher gas and food prices, according to Mathews. The picture has improved since last year, when lower-income households pulled back, and most income groups now show year-over-year spending growth. The split still holds. Wealthier shoppers carry a disproportionate share of sales.
Deloitte shows the same spread from the buyer's side. In its 2026 Deloitte Holiday Retail Survey, households earning $200K or more plan to spend an average of $3,607 this season. Households earning under $50K plan to spend $693. That gap is more than 5 times. The overall average expected spend is $1,654, up 4%. That number is accurate. It's also close to useless for deciding who to serve, what to price, or where to place inventory.
A caution on the data. The survey polled 4,000 US consumers, and the $200K+ group is the smallest slice at 391 respondents. Treat the exact gap as directional. NRF's forecast, built on economic modeling rather than a consumer survey, points the same way.
The size of the split is also debated. In Have U.S. consumers gone "K-shaped"? A review of the data, the Federal Reserve Bank of Minneapolis found that available measures disagree. Moody's Analytics estimates that the top 10% of households by income account for more than 45% of spending, a figure the review says has drawn skeptics. The Bureau of Labor Statistics survey puts the top 10% at 23%, which the review still calls disproportionate. Its conclusion was that the data don't yet tell one clear K-shaped story.
That doesn't weaken the planning case. It sharpens it. Both the estimated and the survey-based measures show high-income households carrying more than their share. How lopsided your own market is can only be answered with your own customer data.
Spending Level Is Not the Only Split
Income is one cut of the customer base. It isn't the only one.
The same Deloitte survey found that 38% of shoppers qualify as holiday value seekers, meaning they use 5 or more money-saving behaviors. They still expect to spend 12% more than other shoppers. Deloitte reports that 62% of them bought private label in the past 6 months, against 46% of others, and that 65% were already shopping by late October, against 48%. These buyers don't spend less. They spend differently, and they start earlier.
Generation adds another cut. Gen Z and millennials are expected to account for 50% of holiday spending for the first time in the survey's history, and 72% of Gen Z will consider luxury gifts. Price sensitivity and appetite for premium products can coexist in the same market. Retail Strategy leader Brian McCarthy of Deloitte put it plainly in Deloitte: Holiday Spending Set to Increase 4% While Shoppers Focus on Value. Shoppers are "not looking for a one-size-fits-all experience."
Income, generation, channel and behavior cross each other. A plan that sorts buyers on one dimension misses the others. Discounting tuned to the average can give away margin to buyers who would have paid full price, while the buyers who needed help still walk away.
Growth Can Hide the Split
Averages still earn their place in reporting. They fail as a description of any single customer.
A rising average can mean more customers buying, existing customers buying more often, higher prices, or larger purchases from a concentrated group. Each calls for a different response. A business whose growth depends on a narrow group of high spenders carries more concentration risk than one whose growth is broad, even when the two reports look the same. Look at the median and the spread alongside the mean.
Your Customers' Customers Sit on the Same K
If you sell to retailers, brands, distributors, landlords, lenders or software providers, you might read all this as your customers' problem. It's yours too.
Your orders follow the mix of buyers behind your direct customers, not their total sales. A customer posting solid growth may be leaning on a narrow group of high-spending buyers. When that group pauses, your orders follow. Concentration at the buyer level is concentration in your revenue, one step removed.
Pricing pressure follows the same path. Mathews said competition and shoppers' focus on affordability will make it hard for retailers to raise prices, and that retailers have already absorbed many tariff costs instead of passing them on. He suggested they may do the same with higher freight costs. That pressure has to land somewhere. In my judgment, suppliers should expect it to show up in questions about their own pricing, terms and volume commitments.
This is where the K-shaped consumer reaches businesses that never touch a consumer. A supplier's forecast inherits the demand mix of the customer it serves. If that mix is lopsided, the forecast is lopsided too, and an average will hide it. Pull your top 20% of accounts and map them by the end markets behind them, not only by revenue. That view should shape credit terms, inventory commitments, account development and where the next sales investment goes.
These figures describe United States consumers. Purchasing power, household debt and inflation exposure vary widely across Europe, Asia and Latin America, so a segmentation built on US income thresholds won't travel. The principle does. Even within one country, urban and rural households, and younger and older ones, experience the same economy differently.
Go-to-Market Looks Different on Each Arm
Segmentation only pays off when it changes what you do. For go-to-market strategy, that means the two arms of the K usually need different offers, not different discounts on the same offer.
Deloitte found that 47% of respondents prefer to give one meaningful, higher-cost gift over several smaller ones, and that half of shoppers plan to gift an experience. Among those experience givers, 79% want to pair it with a physical item. Buyers who favor one higher-cost gift suit bundles and curation, while value seekers suit loyalty rewards and private-label options. Some 38% of value seekers plan to redeem loyalty points, against 24% of others. Channel follows the same logic. The survey shows 55% of retail holiday budgets planned for online and 45% in-store, with in-store still preferred for food and beverage.
Be careful about retreating to the middle. When buyers separate on what they value, a business positioned between the two can struggle to explain why it deserves attention. You don't need to chase every segment. You need to choose the customers you can serve profitably and make the reason to choose you plain. Blended acquisition costs and average lifetime value will hide where the money goes, including when you pay heavily to win customers in one segment while under-serving another. Segmentation without a view of profitability is a more detailed way to misunderstand the business.
Plan for the Split Instead of the Mean
You don't need a new planning system. You need to stop feeding the old one a single average. Four contrasts show what changes:
Demand. The average assumes buyers cluster around a middle. The evidence shows spread, from the gap of more than 5 times in planned spending to NRF's sector-level concentration.
Pricing. One adjustment across the base assumes buyers react alike. Deal hunters who plan to spend more show that price sensitivity and spending power don't always move together.
Sales efficiency. Blended acquisition cost and lifetime value hide segment economics. Measure both by segment.
Go-to-market. Broad pursuit of volume gives way to offers, channels and resources matched to the segments you can serve profitably.
Five checks belong in every planning cycle. Separate where growth comes from, whether price, volume, frequency or concentration. Track which customers are growing more sensitive to value through discount use, substitutions, order size and renewals. Test whether your offer gives each segment a clear reason to choose it. Compare margins by segment, not only in aggregate. And stress-test the plan against a slowdown in your strongest segment, including the financial health of your major B2B accounts. Make these part of regular planning, not a reaction to holiday forecasts.
Averages are comfortable because they give everyone the same answer. The split gives you a harder one, and a more useful one. The leaders who succeed won't be those who predict the average most accurately. They'll be those who see when it no longer describes the market they serve.
When One Plan Has to Serve Two Kinds of Customers
When demand splits, the strategy that carried a company through growth can stop fitting. Leaders facing a shift in their customer base, pressure on pricing, or a go-to-market plan that no longer matches who is buying turn to Aspirations Consulting Group to work through those intersecting challenges and build a path forward.
Get Weekday Insight on Where Your Demand Is Heading
Request a complimentary subscription to ACG Strategic Insights™ and receive leadership and business strategy insight every weekday, alongside more than 10 million current and aspiring executives worldwide.
Thanks for reading!
~ Jerry Justice
Living to Serve, Serving to Lead™


Comments